Making a Better MemoryViz In Rust Without Knowing Rust
Pytorch Memory Viz
Pytorch memory profiler/vizualizer is one of the tools I find most useful when debugging a difficult OOM error in ML code. It’s important to utilize as much memory as possible when using a GPU, but it’s not straightforward to do so when implementing novel ML approaches. It’s surprisingly easy to forget a `.detach` and end up including a huge autograd graph, or instantiate a huge intermediate tensor without thinking about how large it is.
Torch has an invaluable tool called _record_memory_history which keeps a record of all CUDA allocations and frees. Once this is saved to disk, the profile can be parsed and create a stacked bar chart of all memory allocated at a particular point in training. This is very useful for noticing many issues.
The suggested way to parse and visualize the profile is via the memory_viz online tool. This is super low-friction and easy to use. However, it struggles with large profiles, generally not being able to display profiles over around 500MB. It also can get very laggy on profiles over about 100MB. It’s possible to get around this by utilizing techniques like only profiling particular hot loops, but ideally I’d like to be able to profile an entire lifetime of model-loading, taking a couple of training steps, then saving the model. If the model under training has a lot of small tensors, the profile can be easily a few GB. So I decided to make a better version that runs in a compiled language like Rust. Unfortunately, I don’t know Rust at all: I used it in some small projects many years ago, but nothing since then.
Making the Desktop Memory Viz
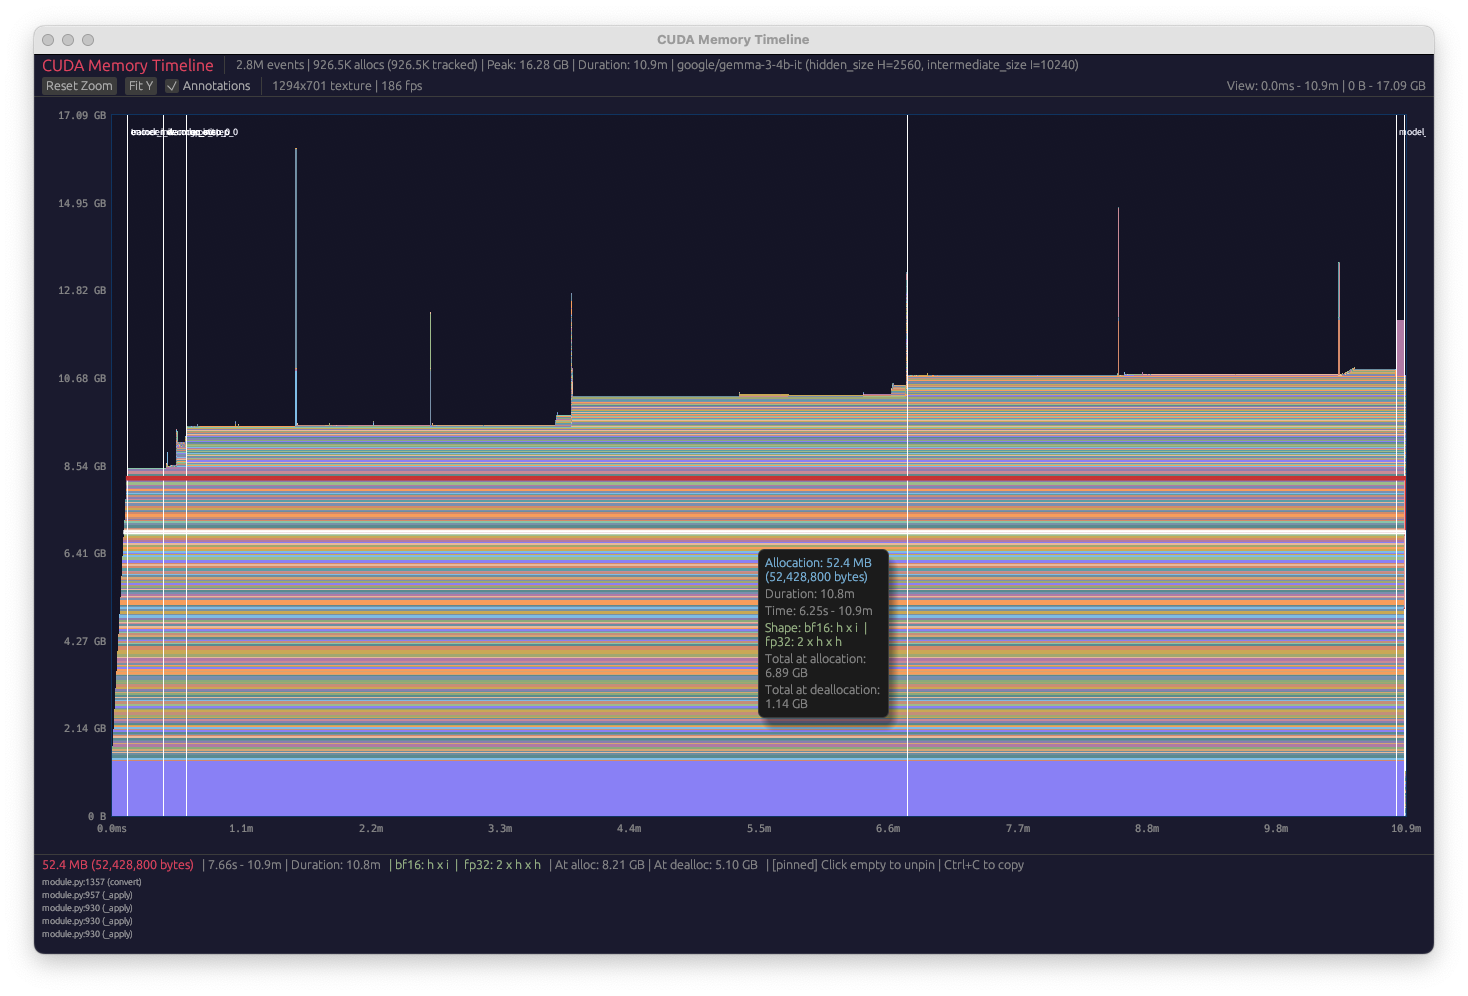
To make the desktop memory viz, I used Claude Code. I initially wanted to test out the new teams feature to see if I could get Claude to build the app entirely autonomously. However, I needed to use quite a lot of iteration with it in the end. Mostly, this consisted of me telling Claude to brainstorm ways to get the app to render faster, as its initial approach was very laggy. Initially, it was trying to draw each polygon on every frame. However, after brainstorming, we came up with an approach where we pre-compute a rasterization mask, mapping each pixel to a particular tensor. This dramatically improves performance when not moving the screen, and the performance when moving the screen is still okayish. After the optimizations, the desktop version is able to render 10GB traces with no problems, over an order of magnitude larger than the web version.
Extra Features
I had a lot of fun adding extra features. Firstly, we fixed several of the UX issues with the web version, such as not being able to select the stack trace since moving the cursor would de-select the current tensor. Then, we added a feature where a tensor is auto-factorized into multiples of the model’s intermediate and hidden size. This is pretty useful when trying to figure out what is happening in a particular block of memory. Finally, we added the ability to view user annotations, so we don’t need to e.g. guess which part of the profile corresponds to the forward and backward pass.